RUO‘ZENLog inTry for freeTry free
A terminal for swing traders · US market

Strong stocks, their earnings and the entry point — on one screen

Daily 1–99 ratings and Algo Rating across the whole US market, quarterly earnings right under the candles, a screener with live mini charts and pullback-to-trend signals in Telegram, with a picture of the chart.

Log in with Telegram

No card, no password — 14 days free after you log in

Running now · real-time quotes · signal algorithm · 18 scenarios 24/7
algoinvesting.trade/
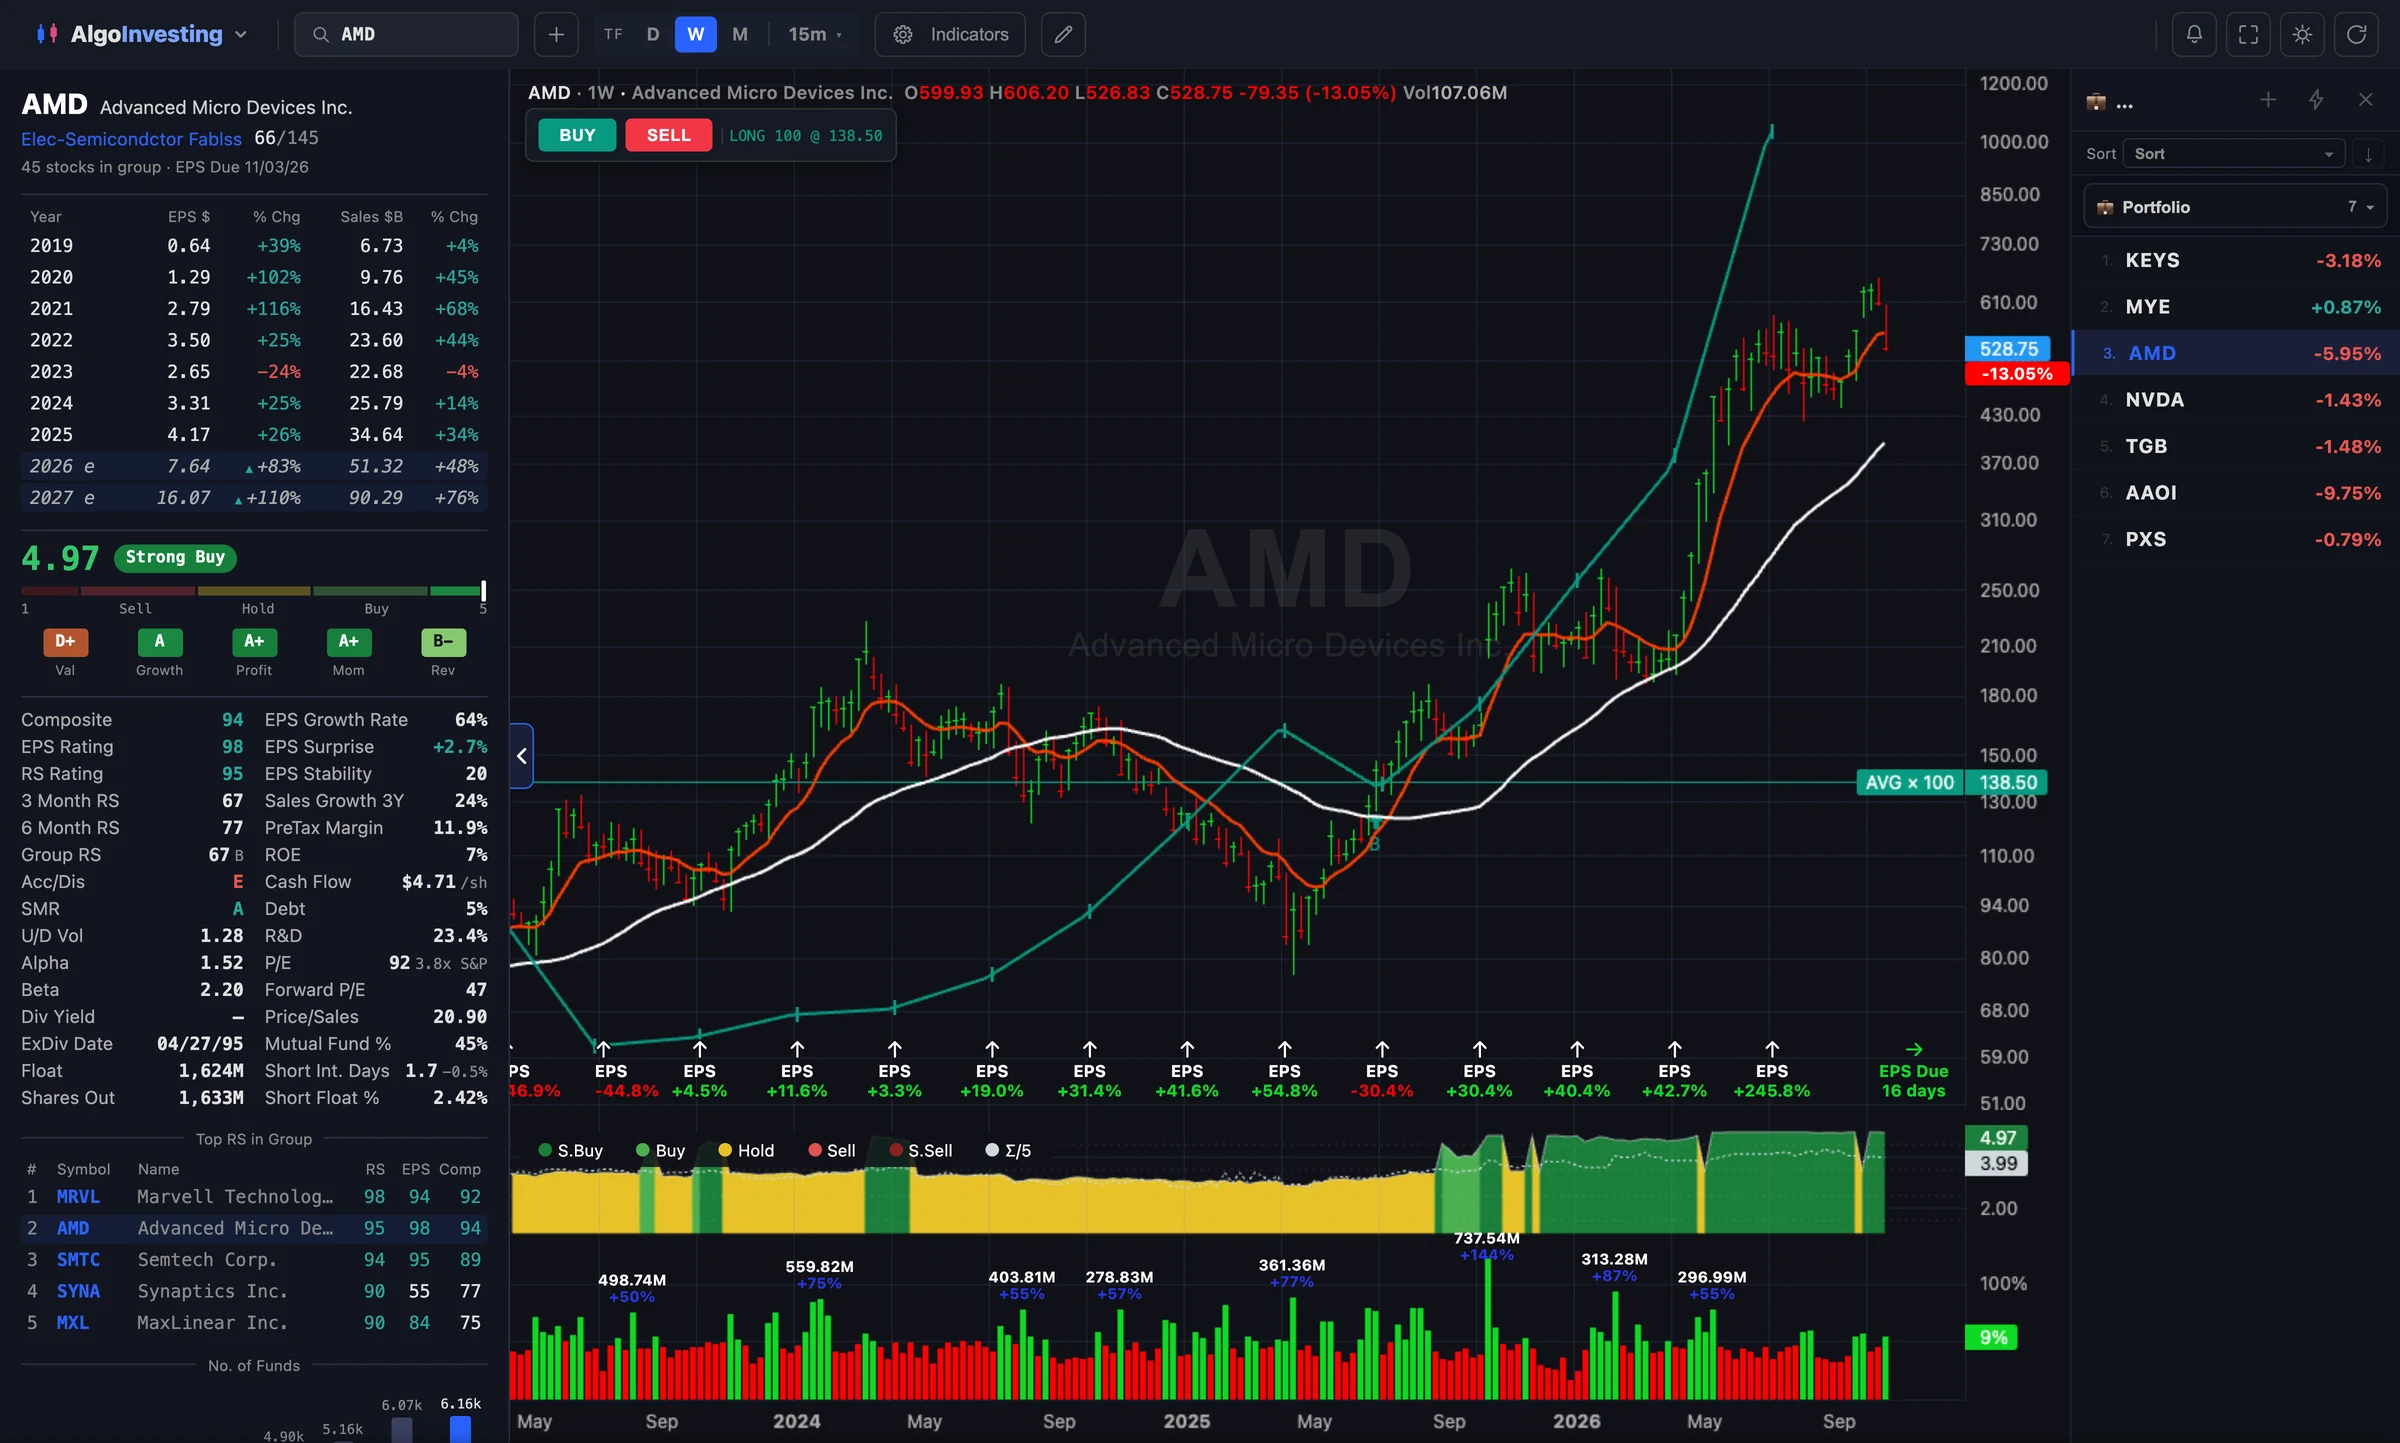
AMD chart screen: ratings column, candles with report marks, Algo Rating strip and volume
Algo Rating and AMD's four factor grades against its sector
How it works

A platform that works while you sleep

At night the algorithms recompute the market, in the morning they refresh the ratings, during the day quotes arrive in real time, and the signal algorithm checks every stock every minute. The whole platform on one live map.

11 500+stocks every day
18working scenarios
24/7no days off
Open the full map
LIVE · 135 nodesOpen
How it works

Seven sections of the terminal, step by step

First the whole screen, then the camera moves in on what matters. Pick a section or a step, or just watch.

The whole market on the first screen
Price, earnings and ratings on one chart
Your screen as a grid of live charts
The whole company: valuation, quality, reports
Your account against the market, day by day
News for the market and for your stocks
The same terminal in your pocket

Real terminal screens on a demo account · captured Oct 18 2026

11,500+US stocks and funds in the database
since 2020daily history for every stock
4,800+companies with a daily Algo Rating
57metrics under every grade
every nightdata updates itself
Features

Everything to find a leader and not miss the entry

01 · Ratings 1–99

Every stock against the whole market, on a scale of 1 to 99

A Composite Rating of 99 means the company beats 99% of the market on earnings, growth, price action and demand from funds. Composite, RS, EPS, SMR and A/D are recalculated every day and mean the same thing in any list.

  • RS Rating — how the price did over 12 months against the market
  • EPS and SMR Rating: earnings, sales, margins, return on equity
  • A/D Rating — whether big funds are buying the stock or getting out
AMD's ratings column next to the chart: annual earnings, Algo, Composite, EPS and RS Rating, industry leaders
Company page: chart and rating table
02 · Algo Rating

Five factors against its own sector — and one overall score

Algo Rating compares a company with its sector on Valuation, Growth, Profitability, Momentum and EPS Revisions and rolls it all into a score from 1 to 5. Under every letter are the metrics, with the company's value and the sector median.

  • The verdict in words: from Strong Sell to Strong Buy
  • 57 metrics for a regular company, 97 for REITs
  • Daily history of the letters: see when a grade started to change
AMD Algo Rating
Strong Buy
4.92
1 · Strong Sell3 · Hold5 · Strong Buy
CValuation
A+Growth
AProfitability
AMomentum
C+EPS Revisions
03 · Earnings on the chart

Company earnings — right under the candles

The yellow line is trailing 12-month earnings per share on the same time scale as the price. A mark under a candle is a report day. You see at once when the price runs ahead of earnings and when it lags behind.

  • Quarterly table: earnings and sales, year-over-year growth
  • Earnings charge — how fast reported earnings grow, ranked across the whole market
  • Moving averages, weekly lines and your drawings are saved for you
AMD · 1DSMA50EMA21EPS, trailing 12 mo.
Q4 25
$1.53+40%
10 270+34%
Q1 26
$1.37+43%
10 253+38%
Q2 26
$1.66+246%
11 536+50%
Q3 26
$2.09+74%
13 377+45%
Earnings per share, $ · sales, $M · year-over-year growth
04 · Screener

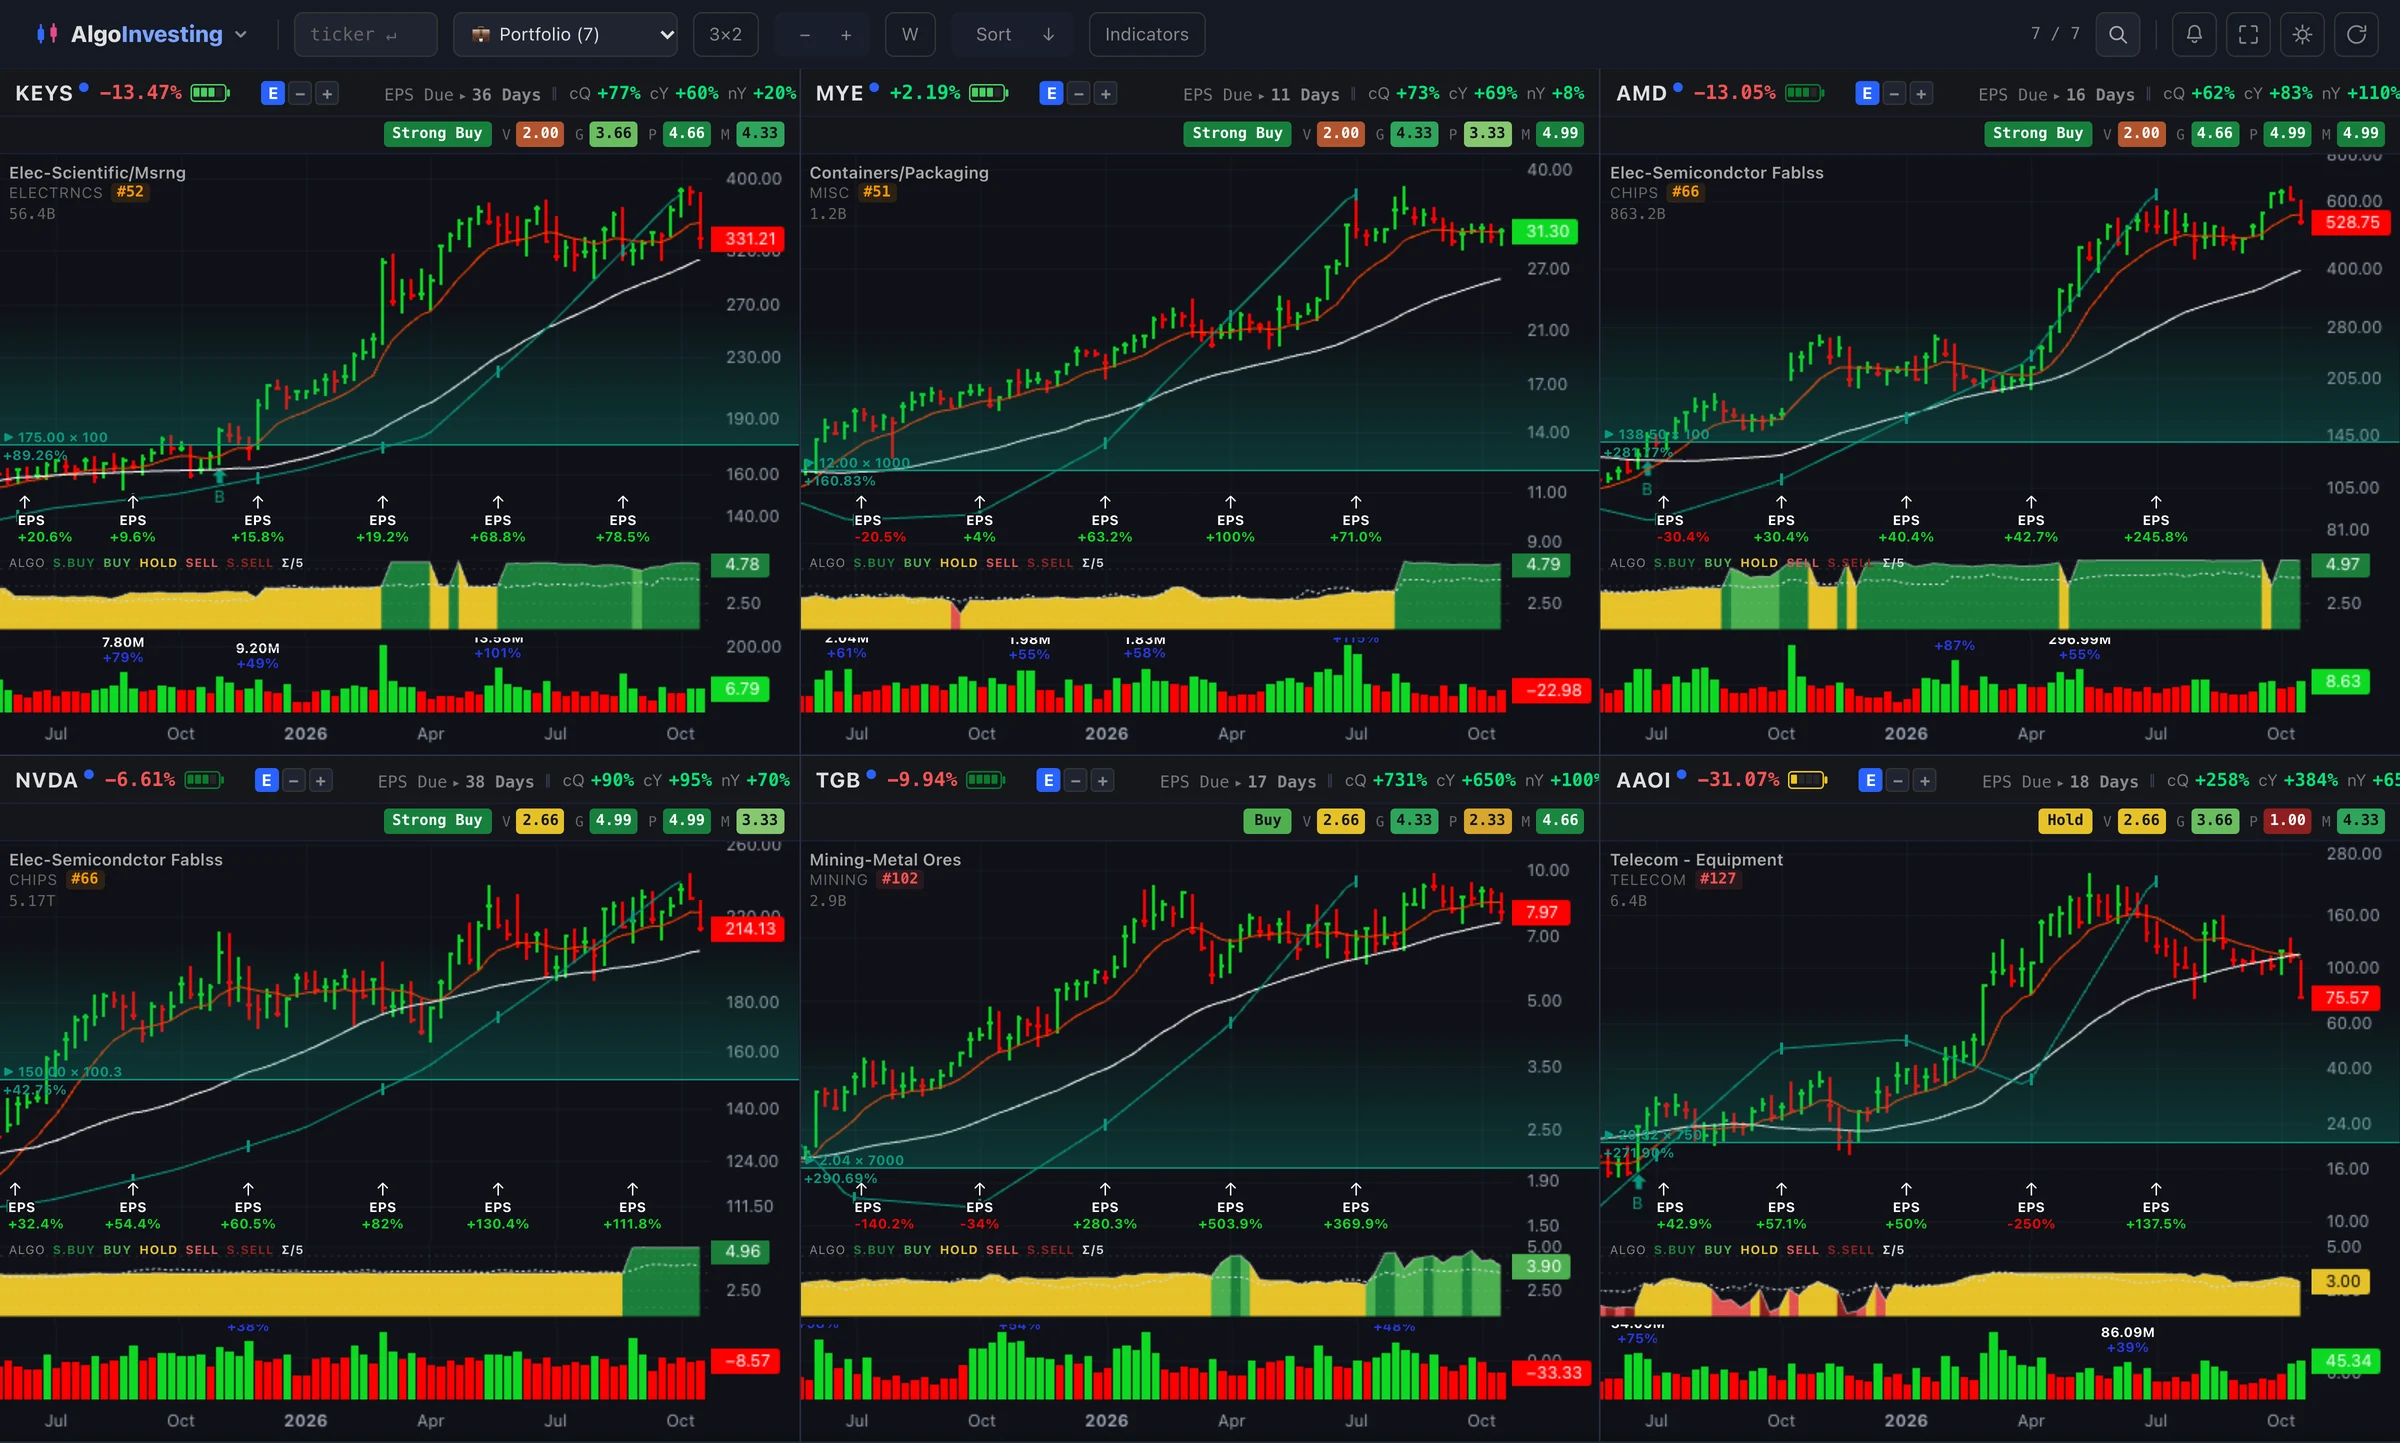
The whole market through your filters — as a grid of live charts

Filter stocks by ratings, industry, earnings, volume and price, and see the result as a grid of mini charts rather than a table of numbers. The “price lags earnings” sort brings up the stocks whose reports grow faster than their quotes.

  • Your own watchlists and saved filters
  • Market breadth and industry rank next to every stock
  • Chart, company page or portfolio — in one click
algoinvesting.trade/grid
Screener grid: six charts with ratings and quarterly earnings
05 · Signals in Telegram

A pullback to the trend — and a message with a chart in Telegram

The monitor watches the market through the whole trading session. When the price dips to the trend line and comes back above it, a signal with a chart picture arrives in the chat. Weekly filters cut out entries against the trend.

  • A signal with the price, the time and the rule that fired
  • No more than one signal per stock per session — no spam
  • An archive of every trigger: go back and see what happened next
AlgoInvesting · signalsbot · in Telegram
VCTR · 112.99Nov 5 · 13:35
Entry signal
06 · Portfolios

A portfolio that does the math itself

Trades with add-ons, stops, commissions and an equity curve against the indices. Positions are revalued in real time, returns for any period, for the account and for every stock.

  • Several portfolios: real, paper, ideas
  • Import a broker statement instead of entering trades by hand
  • Intraday equity curve and mini charts of positions
Demo account equity curve vs the S&P 500
Demo account: an example built in hindsight from stocks with strong ratings. It is not a trading result and not a promise of returns.
07 · Market and news

The whole market — in the time of a morning coffee

A market map by market cap, breadth, top gainers and losers, an earnings calendar and a news feed. Hover over a ticker and its chart opens.

  • Indices and futures before the open
  • Who reports this week — right on the home screen
  • A news story opens next to the stock's chart
Home screen: indices, market breadth, futures, the day's movers and Algo Rating
Market and blog news feed
On your phone

The whole terminal — in your pocket

A separate version for the phone, not a squeezed website: large charts, gestures, the same ratings and signals. Watchlists and portfolios are shared with the computer.

Market on a phone
MarketIndices, market breadth, sectors and the day's movers
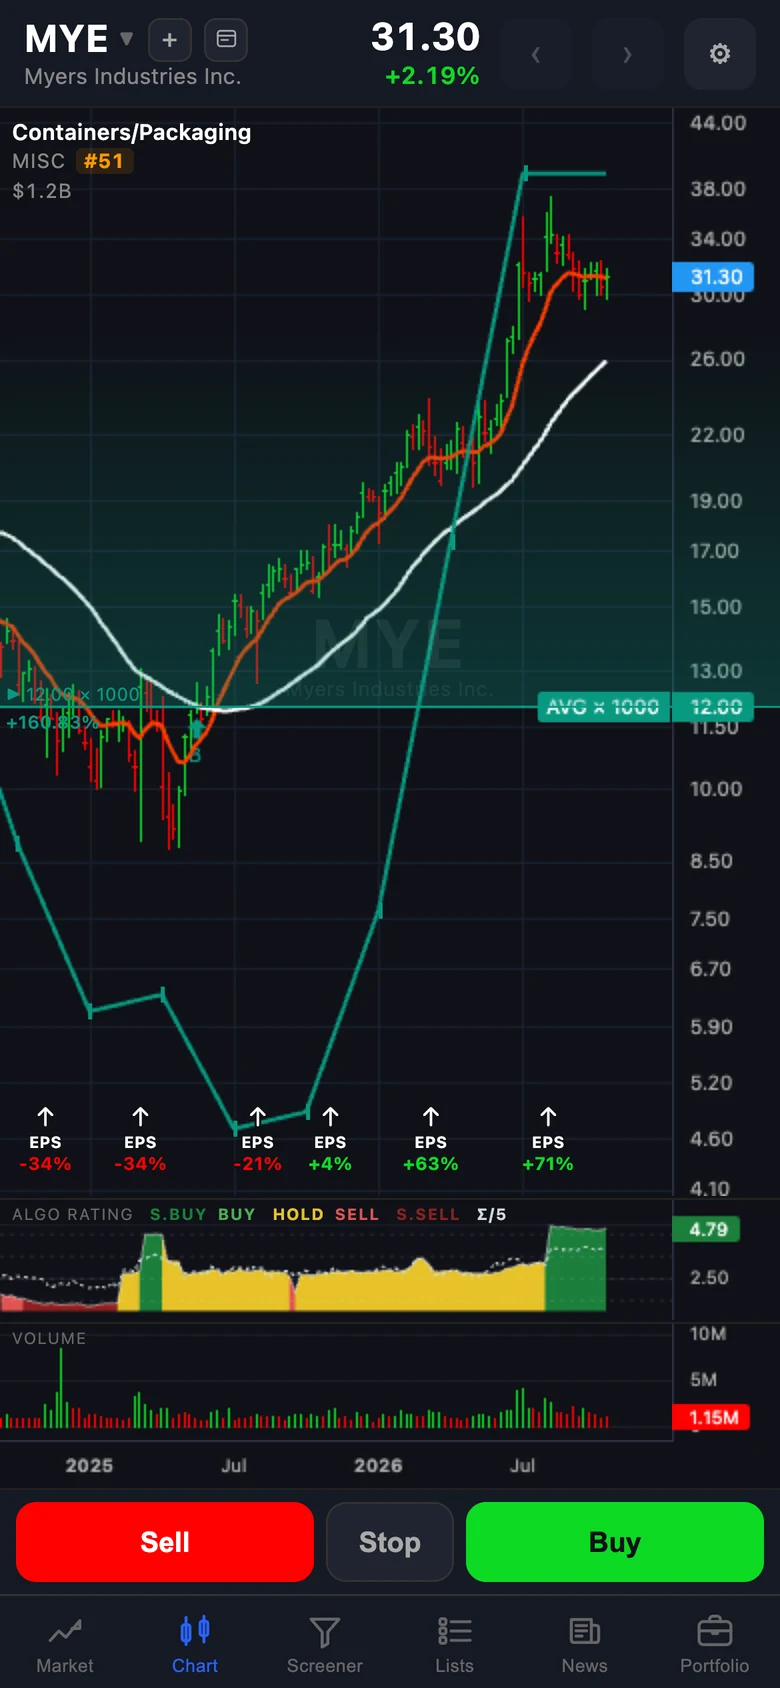
Chart on a phone
ChartEarnings and Algo Rating right under the candles
Intel's company page on a phone: chart, description, grades, quarters, group and news
CompanyGrades, quarters, group, funds and news — on one page
Watchlists on a phone
WatchlistsYour watchlists as a grid of live charts
Portfolio on a phone
PortfolioEquity curve and positions in real time

swipe →

How to start

Three steps — and the terminal is yours

1Log in with TelegramNo password, no email — one button. Signals will later arrive in the same chat.
214 days — freeFull access to every section. No card needed.
3Get to workYour watchlists, portfolios and drawings are saved for you — on your phone too.
Follow us

The market every day in your feed

While the terminal is closed, we write about the market where you already read: an after-close wrap, earnings breakdowns and short videos about the terminal.

Pricing

One terminal — every section on every plan

Plans differ in length and personal space: watchlists, presets, portfolios, devices — and the yearly plan adds live prices and your own signals in Telegram.

Trial
$0
14 days, no card
  • All six terminal sections and the mobile version
  • Prices delayed by 15 minutes
  • Terminal signals: the bell, arrows on charts
  • 1 watchlist
  • 1 screener preset
  • 1 portfolio
  • 1 device at a time
Start for free
Month
$20
30 days
  • All six terminal sections and the mobile version
  • Prices delayed by 15 minutes
  • Terminal signals: the bell, arrows on charts
  • Up to 3 watchlists
  • Up to 3 screener presets
  • Up to 3 portfolios
  • Up to 3 devices at a time
Get a month
Best valueYear
$200
365 days · $17 a month instead of $20
  • All six terminal sections and the mobile version
  • Live prices
  • Terminal signals: the bell, arrows on charts
  • Up to 10 watchlists
  • Up to 10 screener presets
  • Up to 10 portfolios
  • Up to 5 devices at a time
  • Custom signal rules delivered to Telegram
Get a year
FAQ

The essentials

Where does the data come from?Real-time US quotes, daily ratings and quarterly reports are collected from professional market data sources and processed by our algorithms. Everything updates automatically every night.
Where do the ratings come from?It is our own algorithm. It runs around the clock and compares every company with the whole market and with its industry: earnings and sales growth, profitability, valuation, price and volume action. The ratings of the largest research services for investors work the same way — one number instead of dozens of metrics.
How do the plans differ?Every terminal section is open on every plan. What differs is the amount of personal space — watchlists / screener presets / portfolios: trial — 1 / 1 / 1, month — 3 / 3 / 3, year — 10 / 10 / 10. Devices at a time: trial — 1, month — 3, year — 5. Prices on the yearly plan are live, on the others delayed by 15 minutes. The yearly plan also has your own signal rules delivered to Telegram.
What does the strength rating mean?It shows how a stock has risen over the past year compared with every other stock in the market. 99 is better than 99% of stocks, 50 is the middle. Growth leaders are almost always at the top of this scale long before a big move.
How often are the ratings updated?Every trading day: overnight the whole market is recalculated from the close. Every screen shows the date of its data.
What is a signal?The moment when a stock in an uptrend pulls back to a key weekly moving average and comes back above it — a classic entry point. The terminal watches the whole market during the session and sends the signal to Telegram at once — with a picture of the chart.
Can I set up my own signals?Yes, on the yearly plan: your own rules on your watchlists. You choose the touch line and the trend line (EMA or SMA; daily, weekly or monthly), thresholds and weekly conditions — the terminal checks them during the session and sends the ones that fire to your Telegram, with a chart and the rule's lines.
Is this investment advice?No. It is an analysis tool: it shows strength, reports and entry points, and the decision to trade is yours.
Who sees my watchlists and portfolios?Only you. Watchlists, portfolios and chart drawings are stored in your personal folder and are not shown to anyone.
How many devices can I use?On 3 devices at a time — for example a desktop, a laptop and a phone; on the yearly plan on 5 devices, on the trial on 1 device. The device list is on the “Account” page: it shows when and where each login happened, and any device can be disconnected with one button.
How do I start?Log in with Telegram — the first 14 days are free, no card required.
Which market is covered?Stocks and funds traded on US exchanges: more than 11,000 securities.
What happens when the subscription ends?Access to the sections closes, but everything of yours stays in place and opens again when you renew. You can export your data from the account at any time.
Open the terminal today

14 days of full access for free. No password — just Telegram.

Log in with Telegram

No card, no password — 14 days free after you log in